


India hit by soaring fertilizer prices, inefficient subsidies
No country has as much area under farming as India. At 169.3 million hectares (mh) in 2019, its land used for crop cultivation was higher than that of the US (160.4 mh), China (135.7 mh), Russia (123.4 mh), or Brazil (63.5 mh). India has an abundance of land, water, and sunshine to support a thriving agricultural sector thanks to its perennial Himalayan rivers and average annual rainfall of approximately 1,200 mm, compared to 475 mm in Russia, 650 mm in China, and 750 mm in the US. But there’s one resource in which the country is short and heavily import-dependent — mineral fertilizers.
- In value terms, imports of all fertilizers touched an all-time high of $12.77 billion in 2021.
- In 2021-22, India imported:
- 10.16 million tonnes (mt) of urea.
- 5.86 mt of di-ammonium phosphate (DAP)
- 2.91 mt of muriate of potash (MOP).
- In 2021-22, India also produced 25.07 mt of urea, 4.22 mt of DAP, 8.33 mt of complex fertilizers, and 5.33 mt of single super phosphate (SSP).
- Complex fertilizers contain nitrogen-N, phosphorus-P, Potassium-K, and sulphur-S in different ratios.
- The intermediates or raw materials for the manufacture of these fertilizers were substantially imported.
Urea
- Urea’s primary feedstock is natural gas.
- In 2021-22, India imported 23.42 mt of liquefied natural gas (LNG) valued at $13.47 billion.
- The fertilizer sector’s share in the consumption of re-gasified LNG was over 41 percent.
Di-ammonium phosphate (DAP)
- For DAP, domestic manufacturers import intermediate chemicals, namely phosphoric acid and ammonia.
- Some even produce phosphoric acid by importing rock phosphate and sulphuric acid. The latter can be further made from the import of sulphur.
- During 2021, 6.44 mt of phosphoric acid, 2.31 mt of ammonia, 9.66 mt of rock phosphate, 1.92 mt of sulphuric acid, and 1.90 mt of sulphur were imported into the country.
Cost of fertilizer
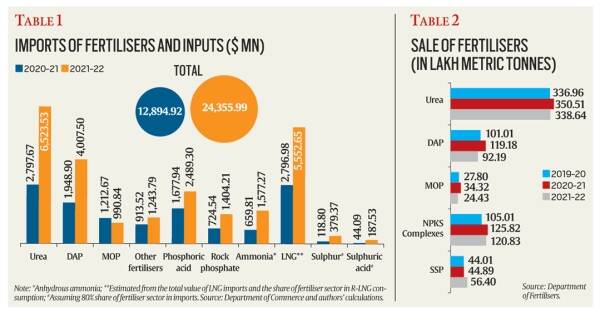
- The above table shows the total value of fertilizer imports by India, inclusive of inputs used in domestic production, was a whopping $24.3 billion in 2021-22.
There are two costs here.
Foreign exchange outgo
- Imports of Urea: Mostly from China, Oman, UAE, and Egypt
- Imports of DAP: China, Saudi Arabia, and Morocco
- Imports of MOP: Belarus, Canada, Russia, Israel, and Jordan
- Imports of LNG: Qatar, US, UAE, and Nigeria
- Imports of phosphoric acid: Morocco, Jordan, Senegal, and Tunisia
- Imports of ammonia: Saudi Arabia, and Qatar
- Imports of rock phosphate: Jordan, Morocco, Egypt, and Togo.
Fiscal cost
- Fertilizers are not only imported, but Indian farmers also pay below what it costs to import or manufacture using imported inputs.
- The difference is paid as a subsidy by the government.
- Both costs are unsustainably high to bear for a mineral resource-poor country.
- India is feeling the impact of it, especially with global prices of Urea, DAP, MOP, phosphoric acid, ammonia, and LNG soaring two to two-and-a-half times in the last year (they have softened a bit of late).
- There was a time farmers had to be incentivized to use chemical fertilizers for boosting crop yields.
- Today, they have to be restrained from over-application.
- Farmers should know India imports half of its natural gas requirement – that will only go up – and hardly has any mineable rock phosphate, potash, or elemental sulphur reserves.
What could be done?
- There is a need to cap or even reduce consumption of high-analysis fertilizers – particularly urea (46 percent N content), DAP (18 percent N and 46 percent P), and MOP (60 percent).
Nitrification inhibition compounds in urea
- These are basically chemicals that slow down the rate at which urea is hydrolyzed (resulting in the production of ammonia gas and its release into the atmosphere) and nitrified (leading to below-ground loss of nitrogen through leaching).
- By reducing ammonia volatilization and nitrate leaching, more nitrogen is made available to the crop, enabling farmers to harvest the same, if not better, yields with a lesser number of urea bags.
- Together with products such as liquid nano urea it is possible to achieve a 20 percent or more drop in urea consumption from the present 34-35 mt levels.
- Nano urea’s ultra-small particle size is conducive to easier absorption by the plants than with bulk fertilizers, translating into higher nitrogen use efficiency.
- That works out to 6.5-7 mt fewer imports, equivalent to $4.5-5 billion at current prices.
Promoting sales of fertilizers
- Promoting sales of SSP (containing 16 percent P and 11 percent S) and complex fertilizers such as “20:20:0:13” and “10:26:26”.
- DAP use should be restricted mainly to paddy and wheat; other crops don’t require fertilizers with 46 percent P content.
- India can also import more rock phosphate to make SSP directly or it can be converted into “weak” phosphoric acid.
- The latter, having only about 29 percent P (compared to 52-54 percent in normal “strong” merchant-grade phosphoric acid), is good enough for manufacturing “20:20:0:13”, “10:26:26” and other low-analysis complex fertilizers.
No plan to cap/reduce consumption of high-analysis fertilizers can succeed without farmers knowing what is a suitable substitute for DAP and which NPK complex or organic manure can bring down their urea application from 2.5 to 1.5 bags per acre. It calls for agriculture departments and universities not just to revisit their existing crop-wise nutrient application recommendations, but disseminating this information to farmers on a campaign mode.